Untitled Document
 |
|
The 20 Hottest Years on Record
|
Global Warming 101
Global average surface temperatures pushed 2005 into a virtual tie
with 1998 as the hottest year on record.[1] For people living in the Northern
Hemisphere—most of the world's population—2005 was the hottest year
on record since 1880, the earliest year for which reliable instrumental records
were available worldwide.
Because most global warming emissions remain in the atmosphere for decades
or centuries, the energy choices we make today greatly influence the climate
our children and grandchildren inherit. We have the technology to increase
energy efficiency, significantly reduce these emissions from our energy and
land use, and secure a high quality of life for future generations. We must
act now to avoid dangerous consequences.
The year 2005 exceeded previous global annual average temperatures despite
having weak El Niño conditions at the beginning of the year and normal
conditions for the rest of the year. (El Niño is a period of warmer-than-average
sea surface temperatures in the east-central Pacific Ocean that influences weather
conditions across much of the globe.) In contrast, the record-breaking temperatures
of 1998 were boosted by a particularly strong El Niño.
The record heat of 2005 is part of a longer-term warming trend exacerbated
by the rise of heat-trapping gases in our atmosphere that is due primarily to
our burning fossil fuels and clearing forests. Nineteen of the hottest 20 years
on record have occurred since 1980 (see table).
The record surface temperatures of the past 20 years reinforce other indications
that global warming is under way. For example, the observed rise in average
surface temperatures has been accompanied by warming of the atmosphere and oceans,
and increased melting of ice and snow. These observations, summarized briefly
below, paint a consistent picture of widespread and significant changes in global
climate over the past several decades.
Evidence of Twentieth Century Global Warming
Warming of the Troposphere
A 2005 re-analysis of satellite observations of temperature trends in the
troposphere—the layer of atmosphere extending about five miles up from
Earth's surface—uncovered errors in previous studies. The updated studies
show that air temperatures have increased in the past 20 years or so, consistent
with the fundamental understanding that increases in surface temperatures are
accompanied by increases in air temperatures above the surface. The new results
are also consistent with recent increases in tropospheric water vapor, which
would be expected when rising temperatures accelerate ocean evaporation.
By comparing several sets of data from satellites and weather balloons, these
new atmospheric analyses account for drifts in satellite orbits and changes
in instrumentation over the measurement period. While the corrected results
represent only one of several pieces of global warming evidence, they are important
in part because the earlier flawed analysis has often been cited.
Melting of Snow and Ice
Further evidence of widespread warming comes from observations of seasonal
snow and frozen ground coverage.
The extent and duration of frozen ground have declined in most locations. Snow
cover in the Northern Hemisphere has declined about five percent over the past
30 years, particularly in late winter and spring, and the freezing altitude
has risen in every major mountain chain. Alpine and polar glaciers have retreated
since 1961, and the amount of ice melting in Greenland has increased since 1979.
Over the past 25 years, the average annual Arctic sea ice area has decreased
by almost five percent and summer sea ice area has decreased by almost 15 percent.
The collapse of the Larsen Ice Shelf off the Antarctic Peninsula appears to
have no precedent in the last 11,000 years.
Melting of the Greenland Ice Sheet
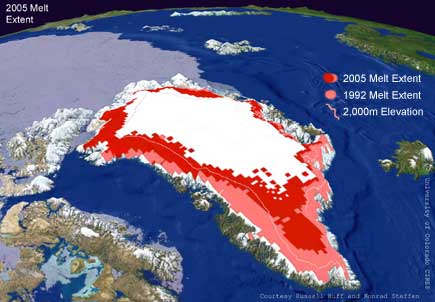
Satellites are used to map the extent and duration of snowmelt on the Greenland ice sheet. The dark red area represents the extent of snowmelt in 2005the most extensive in the 27-year history of data collection. Figure courtesy of NOAA and CIRES
Warming of the Oceans
Oceans comprise 97 percent of Earth's water. They have an average depth of
approximately 13,000 feet (4 kilometers). It takes a great deal of heat to raise
the temperature of this huge body of water, and the oceans have absorbed the
bulk of Earth's excess heat over the past several decades. (See figure, "Estimates
of Earth's Heat Balance.") From 1955 to 1998, the upper ~9,800 feet (3,000
meters) of the ocean have warmed by an average 0.067 degrees Fahrenheit (0.037
degrees Celsius).
Estimates of Earth's Heat Balance
The oceans have absorbed the bulk of Earth's excess heat over the past several decades.
If only a small fraction of the heat currently stored in the oceans were released,
it would significantly warm the atmosphere and melt the world's glaciers. For
a hypothetical example, if the average temperature of the world's oceans increased
by 0.18 degree Fahrenheit (0.1 degree Celsius) and this heat was transferred
instantly to the atmosphere, the air temperature would increase by about 180
degrees Fahrenheit (100 degrees Celsius). In reality, the circulation and redistribution
of this excess heat is a slow process. Even if we could maintain atmospheric
CO2 concentrations at today's level, stored heat released by the oceans will
cause Earth's average surface temperature to continue rising approximately one
degree Fahrenheit (half a degree Celsius) in the coming decades. To put this
into perspective, this is the same as the global average temperature rise that
occurred over the last century. The warming of the oceans and the melting of
glaciers worldwide have already caused sea levels to rise during the twentieth
century, and most of this rise has come in the past few decades.
The Role of Natural Variability
Human-induced warming is superimposed on natural processes to produce the observed
climate. Because these natural fluctuations (which are always present) play
a role in determining the precise magnitude and distribution of temperature
in a particular year, record warmth in any one year is not in itself highly
significant. What is noteworthy, however, is that global average temperatures
experienced a net rise over the twentieth century, and the average rate of this
rise has been increasing. When scientists attempt to reproduce these twentieth
century trends in their climate models, they are only able to do so when including
human-produced heat-trapping emissions in addition to natural causes.
[1] The years 1998 and 2005 are so similar (i.e., within the
error range of the different analysis methods or a few hundredths of a degree
Celsius) that independent groups (e.g., NOAA, NASA, and the United Kingdom Meteorological
Office) calculating these rankings based on reports from the same data-collecting
stations around the world disagree on which year should be ranked first. Annual
global rankings are based on combined land-air surface temperature and sea surface
temperature since 1880.
Dr. Marcia Baker (professor emeritus in Earth and Space
Sciences and Atmospheric Sciences at the University of Washington) prepared
this summary with input from Dr. Brenda Ekwurzel (climate scientist at the Union
of Concerned Scientists).
References
Arctic Climate Impact Assessment. 2004. Impacts of a Warming Arctic. Cambridge,
UK: Cambridge University Press. Available at http://www.acia.uaf.edu.
Arrenhius, S. 1896. On the influence of carbonic acid in the air upon the temperature
of the ground. Philosophical Magazine 41:237-276.
Barnett, T.P., D.W. Pierce, and R. Schnur. 2001. Detection of anthropogenic
climate change in the world's oceans. Science 292:270-274.
Domack, E., D. Duran, A. Leventer, S. Ishman, S. Doane, S. McCallum, D. Amblas,
J. Ring, R. Gilbert and M. Prentice. 2005. Stability of the Larsen B Ice Shelf
on the Antarctic Peninsula during the Holocene Epoch. Nature 436:681-685.
Fu, Q., C. M. Johanson, S. G. Warren and D. J. Seidel. 2004. Contribution of
stratospheric cooling to satellite inferred tropospheric temperature trends.
Nature 429:55-58.
Hansen, J., L. Nazarenko, R. Ruedy, M. Sato, J. Willis, A. Del Genio, D. Koch,
A. Lacis, K. Lo, S. Menon, T. Novakov, J. Perlwitz, G. Russell, G. A. Schmidt,
N. Tausnev. 2005. Earth's energy imbalance: Confirmation and implications. Science
308:1431-1435.
Intergovernmental Panel on Climate Change. 2001. Climate Change 2001: The Scientific
Basis. Cambridge, U.K.: Cambridge University Press.
Krabill, W., E. Hanna, P. Huybrechts, W. Abdalati, J. Cappelen, B. Csatho,
E. Frederick, S. Manizade, C. Martin, J. Sonntag, R. Swift, R. Thomas and J.
Yungel. 2004. Greenland Ice Sheet: Increased coastal thinning. Geophysical Research
Letters 31.
Levitus, S., J. Antonov, and T. Boyer. 2005. Warming of the world ocean, 1955-2003.
Geophysical Research Letters 32.
Mears, C.A., and F.J. Wentz. 2005. The effect of diurnal corrections on satellite-derived
lower tropospheric temperatures. Science 309:1548-1551.
Mote, P. W., A..F. Hamlet, M.P. Clark and D. P. Lettenmaier 2005. Declining
mountain snowpack in western North America. Bulletin of the American Meteorological
Society 86:39-49.
Rodhe, H., and R.J. Charlson, eds. 1998. The Legacy of Svante Arrhenius: Understanding
the Greenhouse Effect. Royal Swedish Academy of Sciences, Stockholm University.
Santer, B.D., T.M.L. Wigley, C. Mears, F.J. Wentz, S.A. Klein, D.J. Seidel,
K.E. Taylor, P.W. Thorne, M.F. Wehner, P.-J. Gleckler, J.S. Boyle, W.D. Collins,
K.W. Dixon, C. Doutriaux, M. Free, Q. Fu, J.E. Hansen, G.S. Jones, R. Ruedy,
T.R. Karl, J.R. Lanzante, G.A. Meehl, V. Ramaswamy, G. Russell, and G.A. Schmidt.
2005. Amplification of surface temperature trends and variability in the tropical
atmosphere. Science 309:1551-1556.
Sherwood, S., J. Lanzante, and C. Meyer. 2005. Radiosonde daytime biases and
late-20th century warming. Science 309:1556-1559.
Siegenthaler, U., T.F. Stocker, E. Monnin, D. Lüthi, J. Schwander, B.
Stauffer, D. Raynaud, J.-M. Barnola, H. Fischer, V. Masson-Delmotte and J. Jouzel.
2005. Stable carbon cycle-climate relationship during the late Pleistocene.
Science 310:1313-1316.
Steffen, K., and R. Huff. 2005. Greenland Melt Extent, 2005. Cooperative Institute
for Research in Environmental Sciences (CIRES), University of Colorado at Boulder
and National Oceanic and Atmospheric Administration (NOAA). Available at http://cires.colorado.edu/science/groups/steffen/greenland/melt2005.
United Kingdom Climate Research Unit (CRU). 2005. Global Temperature for 2005:
Second warmest year on record. Norwich U.K. Available at http://www.cru.uea.ac.uk/cru/press/2005-12-WMO.pdf
U.S. Department of Energy (DOE). 2005. Emissions of Greenhouse Gases in the
United States 2004. DOE/EIA-0573(2004). Washington DC. Available at ftp://ftp.eia.doe.gov/pub/oiaf/1605/cdrom/pdf/ggrpt/057304.pdf.
U.S. National Aeronautics and Space Administration (NASA). 2005. Global Temperature
Trends: 2005 Summation. NASA Goddard Institute for Space Studies (GISS). New
York, NY. Available at http://data.giss.nasa.gov/gistemp/2005/.
U.S. National Oceanic and Atmospheric Administration (NOAA). 2006. Climate
of 2005 –Annual Report. National Climate Data Center (NOAA) Asheville,
NC. Available at http://www.ncdc.noaa.gov/oa/climate/research/2005/ann/global.html
______________________________
Read from Looking Glass News
Greenland's
Ice Cap is Melting at a Frighteningly Fast Rate
A
Dying Planet
Cooling
the Mall, Heating the Planet
Air-conditioning:
Our Cross to Bear
Big
business & global warming
Global
Warming Debate Suppressed
The
Global Warming Denial Lobby
Earth
Faces "Catastrophic Loss of Species"
First
Half of 2006 Is Warmest on Record
Study
says Earth's temp at 400-year high
Ice-capped
roof of world turns to desert
Global
Warming Hits Canada's Remotest Arctic Lands
Greenland
ice swells ocean rise
January
Was America's Warmest on Record
Ocean's
temperature off Santa Barbara now highest in 1,400 years
Polar
bears drown as ice shelf melts
All "Environment"
News Articles